Turn your phone sideways for a better EKG view.

Free EKG Simulator & ECG Simulator

Zoom In
Zoom Out
Loading...
Click the chart to play/pause (when not annotating)

Rhythm Description

Select a rhythm to see the description.

EKG Basics

An EKG (electrocardiogram) records the electrical activity of the heart over a period of time. Here are some important measurements:

  • Normal QRS duration: 0.08 to 0.10 seconds
  • PR interval: 0.12 to 0.20 seconds
  • QT interval: 0.35 to 0.45 seconds
  • Standard grid measurements: Each small box represents 0.04 seconds horizontally and 0.1 mV vertically.

Grid Details

The EKG grid is composed of small and large boxes:

EKG Waves and Intervals Diagram
  • Small box: 0.04 seconds (40 ms) horizontally and 0.1 mV vertically.
  • Large box: 0.20 seconds (200 ms) horizontally and 0.5 mV vertically.

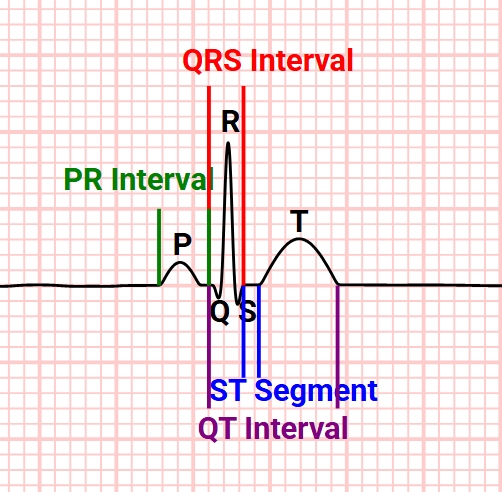
Understanding Intervals and Segments

  • P wave: Represents atrial depolarization. Duration: up to 0.12 seconds.
  • PR interval: Time from the onset of atrial depolarization to the onset of ventricular depolarization. Duration: 0.12 to 0.20 seconds.
  • QRS complex: Represents ventricular depolarization. Normal duration: 0.08 to 0.10 seconds. A duration longer than 0.12 seconds may indicate a bundle branch block or other conduction delay.
  • ST segment: The flat, isoelectric section of the EKG between the end of the S wave and the start of the T wave. It represents the interval between ventricular depolarization and repolarization.
  • T wave: Represents ventricular repolarization. The shape and duration of the T wave can provide important information about electrolyte imbalances, ischemia, and other conditions.
  • QT interval: Time from the beginning of the QRS complex to the end of the T wave, representing the total time for ventricular depolarization and repolarization. Duration: 0.35 to 0.45 seconds.

Clinical Significance

  • Prolonged QT interval can predispose to ventricular arrhythmias like Torsades de Pointes.
  • Shortened PR interval may indicate pre-excitation syndromes like Wolff-Parkinson-White (WPW) syndrome.
  • Elevated ST segment can be a sign of myocardial infarction (heart attack).
  • Depressed ST segment may indicate ischemia or strain.

Quiz on the Selected Rhythm

Select a rhythm above to see quiz questions.

About Our Free EKG/ECG Simulator

Our interactive EKG simulator provides healthcare professionals and nursing students with educational cardiac rhythm practice. This free ECG simulator features over 30 different cardiac rhythms, including normal sinus rhythm, arrhythmias, heart blocks, and life-threatening rhythms useful for NCLEX preparation and clinical study.

The simulator includes interactive features for comprehensive practice with cardiac monitoring, rhythm interpretation, and electrocardiogram analysis. Educational features include noise adjustment, grid overlay, annotation tools, and measurement capabilities for cardiac rhythm study and identification.

Key Features of Our EKG Simulator:

  • 30+ educational cardiac rhythms
  • Interactive controls and tools
  • Adjustable noise levels
  • Grid overlay and measurements
  • Annotation and marking tools
  • Quiz mode for self-assessment
  • Mobile-responsive design
  • Telemetry view options
  • Free educational resource
  • Multiple rhythm categories

Frequently Asked Questions

How educational is this EKG simulator for learning purposes?

Can I use this EKG simulator for NCLEX preparation?

What educational features does the EKG simulator include?

Is this EKG simulator free to use?

Does the simulator work on mobile devices?

💡 5 Essential Tips for Reading EKGs Like a Pro

1

Start with Rate and Rhythm

Always check heart rate first (normal: 60-100 bpm), then determine if the rhythm is regular or irregular. Count R-R intervals - they should be consistent in normal sinus rhythm.

2

Look for P Waves

P waves represent atrial depolarization. They should be upright in leads I, II, and aVF, and there should be one P wave before each QRS complex in normal sinus rhythm.

3

Measure PR and QRS Intervals

PR interval (normal: 0.12-0.20 seconds) shows AV conduction time. QRS width (normal: <0.12 seconds) indicates ventricular conduction. Wide QRS suggests bundle branch blocks or ventricular origin.

4

Check for ST Changes

ST elevation may indicate STEMI, while ST depression can suggest ischemia. T wave inversions in multiple leads may indicate old MI or ischemia. Always correlate with patient symptoms!

5

Practice with Real Scenarios

Use this EKG simulator to practice different rhythms repeatedly. Start with normal sinus rhythm, then progress to common arrhythmias like atrial fibrillation, ventricular tachycardia, and heart blocks.

🎯 Pro Tip: Practice interpreting at least 5 different rhythms daily using our simulator above!

📚 Continue Your Learning

📚 References

Click to view 2 sources cited

⚠️ Medical Disclaimer

This EKG simulator is for educational purposes only and is NOT intended for clinical use, patient care, or emergency situations. Always consult current medical protocols and healthcare providers for patient care decisions. Do not use this simulator for real patient diagnosis or treatment.