EKG | ECG Interpretation Made Easy
Perfect for StudentsIllustrated study guide with detailed strip interpretation and comprehensive explanations.
View on Amazon →(affiliate link)
PQRST diagram, quick-lookup table, memory aids & nursing watch-outs. Print it for clinical.
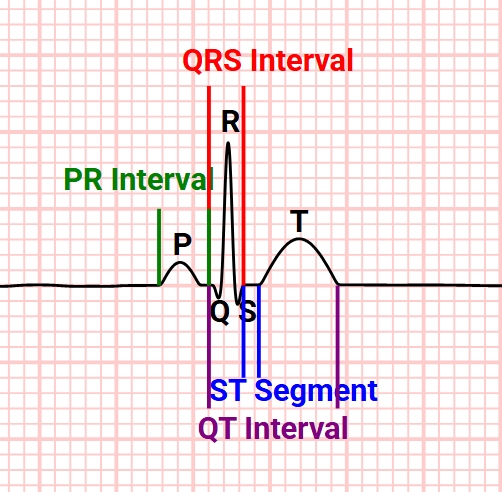
An EKG (electrocardiogram) records the electrical activity of the heart over a period of time. Here are some important measurements:
The EKG grid is composed of small and large boxes:
Your support helps us continue creating free nursing content. Explore our Nursing Essentials page to see our recommended tools and resources.
View Nursing EssentialsOur interactive EKG simulator provides healthcare professionals and nursing students with educational cardiac rhythm practice. This free ECG simulator features over 30 different cardiac rhythms, including normal sinus rhythm, arrhythmias, heart blocks, and life-threatening rhythms useful for NCLEX preparation and clinical study.
The simulator includes interactive features for comprehensive practice with cardiac monitoring, rhythm interpretation, and electrocardiogram analysis. Educational features include noise adjustment, grid overlay, annotation tools, and measurement capabilities for cardiac rhythm study and identification.
Our EKG simulator uses educational waveform algorithms and timing designed for learning cardiac rhythms. The rhythms are created for educational purposes and study, helping students learn rhythm identification and characteristics.
Yes! Our simulator includes all major cardiac rhythms tested on NCLEX exams. Practice identifying normal sinus rhythm, atrial fibrillation, ventricular tachycardia, heart blocks, and other critical rhythms commonly featured in nursing board examinations.
The simulator includes various educational modes and views for comprehensive cardiac rhythm study. Features include rhythm interpretation practice, educational assessments, and tools for learning cardiac monitoring concepts and electrocardiogram analysis.
Yes, our EKG/ECG simulator is completely free for educational use. No registration, downloads, or payments required. Access all features including 30+ rhythms, interactive tools, and quiz modes at no cost.
Yes! Our responsive EKG simulator works seamlessly on smartphones, tablets, and desktop computers. For optimal viewing on mobile devices, we recommend using landscape orientation for the best EKG strip visibility.
Always check heart rate first (normal: 60-100 bpm), then determine if the rhythm is regular or irregular. Count R-R intervals - they should be consistent in normal sinus rhythm.
P waves represent atrial depolarization. They should be upright in leads I, II, and aVF, and there should be one P wave before each QRS complex in normal sinus rhythm.
PR interval (normal: 0.12-0.20 seconds) shows AV conduction time. QRS width (normal: <0.12 seconds) indicates ventricular conduction. Wide QRS suggests bundle branch blocks or ventricular origin.
ST elevation may indicate STEMI, while ST depression can suggest ischemia. T wave inversions in multiple leads may indicate old MI or ischemia. Always correlate with patient symptoms!
Use this EKG simulator to practice different rhythms repeatedly. Start with normal sinus rhythm, then progress to common arrhythmias like atrial fibrillation, ventricular tachycardia, and heart blocks.
Pro Tip: Practice interpreting at least 5 different rhythms daily using our simulator above!
Great job practicing with our simulator! Take your skills to the next level with detailed explanations, additional rhythms, and step-by-step learning guides.
Disclosure: As an Amazon Associate, we earn from qualifying purchases.
Illustrated study guide with detailed strip interpretation and comprehensive explanations.
View on Amazon →(affiliate link)
Comprehensive 12-lead ECG guide with 3-level approach and 50 practice ECGs.
View on Amazon →(affiliate link)
Study Strategy: Use this book to understand the "why" behind what you're seeing in the simulator. Practice here, then read the detailed explanations!
Click to view 3 sources cited
This EKG simulator is for educational purposes only and is NOT intended for clinical use, patient care, or emergency situations. Always consult current medical protocols and healthcare providers for patient care decisions. Do not use this simulator for real patient diagnosis or treatment.