EKG Interpretation Guide
Learn a clear, systematic approach to rate, rhythm, intervals and waveform morphology so you can rapidly spot normal vs abnormal conduction. Reinforce recognition skills using our interactive EKG Simulator.
Educational recognition module – not diagnostic or treatment advice. Follow current institutional policy and licensed provider direction.
Last updated: • Author: Levi Eastwood, RN-BSN.
📄 Want a printable version? 18 rhythms on one sheet.
PQRST diagram, quick-lookup table, memory aids & nursing watch-outs.
1 EKG Basics: Understanding the Fundamentals
What is an EKG?
An electrocardiogram (EKG/ECG) records the electrical activity of the heart. Think of it as a "snapshot" of your heart's electrical system at work. Every heartbeat generates electrical impulses that travel through the heart muscle, and the EKG captures these signals.
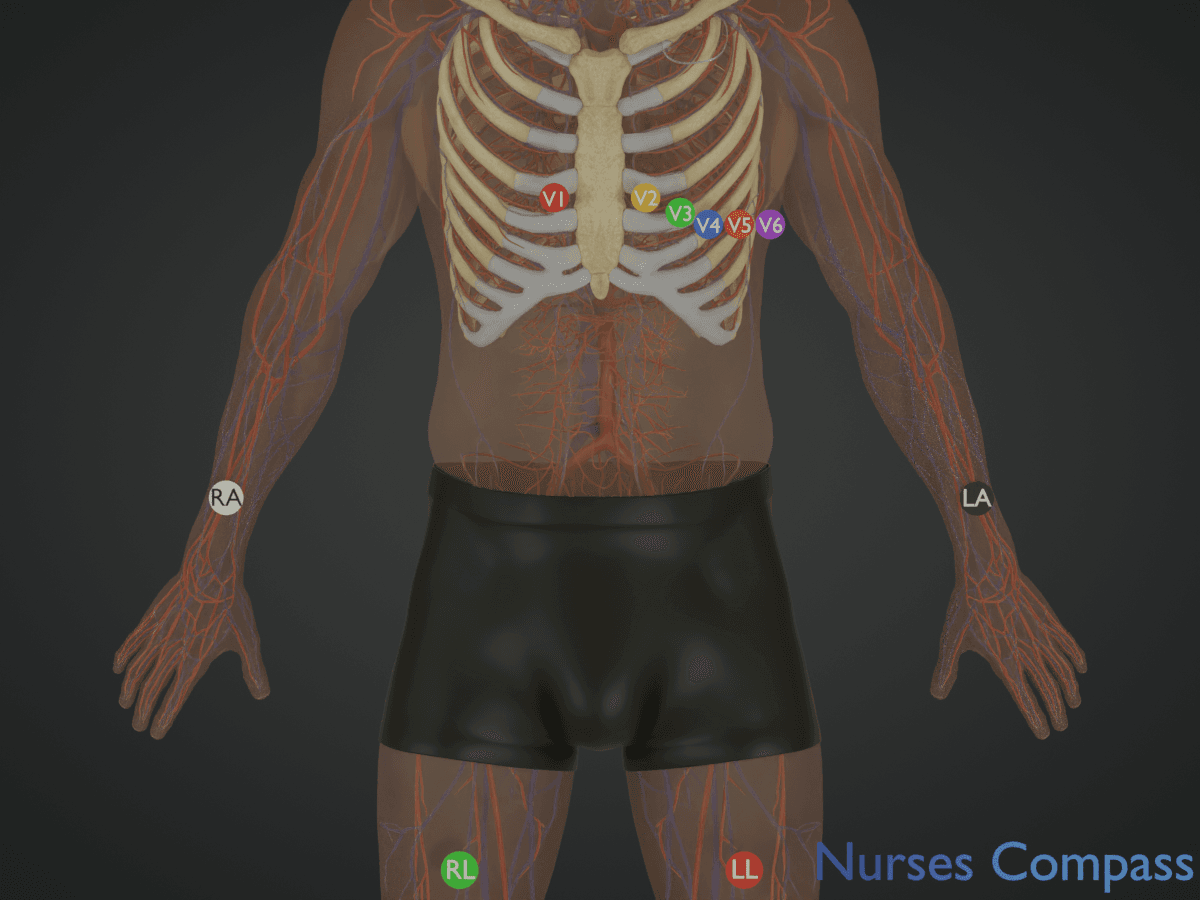
• ≥10 cm from heart
• Wrists/shoulders OR thighs/ankles
The EKG Grid System
EKG paper has a special grid that helps us measure time and voltage:
- Horizontal axis (time): Each small square = 0.04 seconds, Each large square = 0.20 seconds
- Vertical axis (voltage): Each small square = 0.1 mV, Each large square = 0.5 mV
📏 EKG Grid Demonstration
🎯 Key Learning Points
- EKG measures electrical activity, not mechanical function
- Standard paper speed is 25 mm/second
- Standard gain is 10 mm/mV (calibration pulse 10 mm = 1 mV)
- Understanding the grid is essential for accurate interpretation
- Certain patterns may prompt further licensed provider evaluation; always interpret within full clinical context
Practice identifying grid measurements on sample EKG strips.
Sources: Garcia & Holtz, 2013, ECGpedia & LITFL (EKG basics, grid system, electrode placement compared and synthesized).
2 Heart's Electrical Conduction System
The Heart's Electrical Conduction System
The heart has its own electrical system that controls the rhythm and rate. Understanding this system is crucial for EKG interpretation.
The electrical impulse follows a specific pathway through the heart:
- SA Node (Sinoatrial Node): The heart's natural pacemaker (60-100 bpm)
- AV Node (Atrioventricular Node): Delays impulse to allow atrial emptying
- Bundle of His: Conducts impulse to ventricles
- Bundle Branches: Left and right pathways to ventricles
- Purkinje Fibers: Spread impulse throughout ventricles
🎯 Clinical Significance
- Damage to any part of this system can cause arrhythmias
- Backup pacemakers exist if higher ones fail
- Intrinsic rates (if acting as primary pacemaker):
- SA node: 60-100 bpm
- AV node: 45-50 bpm
- Bundle of His: 40-45 bpm
- Bundle branches: 40-45 bpm
- Purkinje fibers: 20-40 bpm
- Understanding normal helps identify abnormal rhythms
Sources: Garcia & Holtz, 2013.
3 EKG Waveforms: P, QRS, and T Waves
🎥 EKG Waveforms Explained
Watch this comprehensive overview of EKG waveforms to enhance your understanding before diving into the details:
📚 Educational Video: Comprehensive guide to understanding EKG waveforms and their clinical significance
🫀 Understanding the Cardiac Cycle Through EKG Waveforms
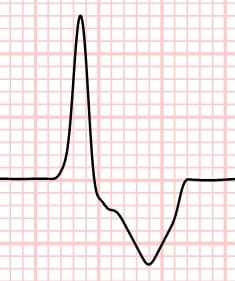
📋 Reference Diagram
Complete PQRST Waves Reference Diagram
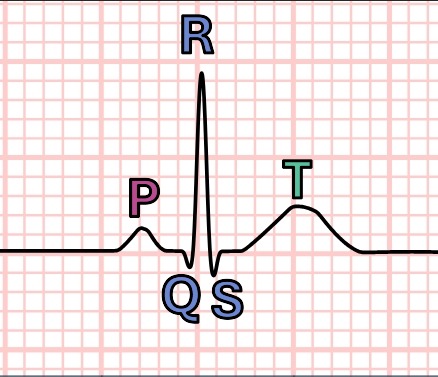
Labeled PQRST components (tap/click to enlarge)
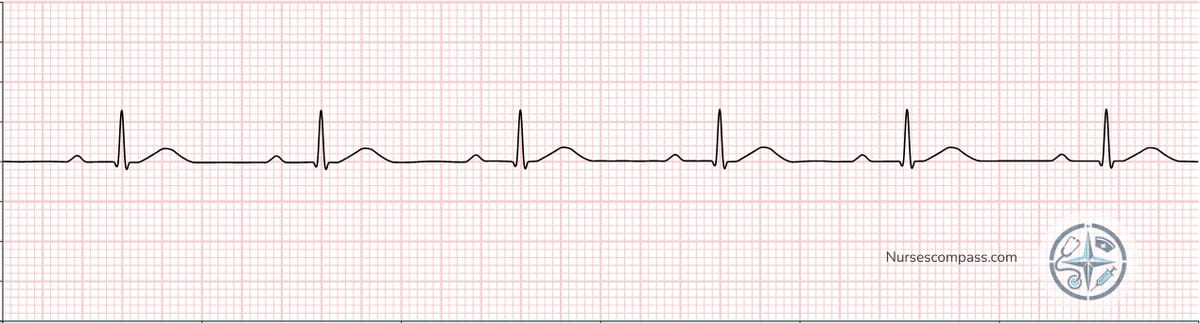
📊 Practice Example

Normal Sinus Rhythm strip (tap/click to enlarge)
🧩 Waveform Components - Learn Each Part
Each waveform represents a specific electrical event in the heart's pumping cycle:
P Wave - Atrial Activity
Represents atrial depolarization (atria contracting)
QRS Complex - Ventricular Activity
Represents ventricular depolarization (ventricles contracting)
T Wave - Recovery Phase
Represents ventricular repolarization (heart muscle returning to rest)
📖 Clinical Note: These are adult normal limits - pediatric values may differ. Always refer to age-appropriate reference ranges in clinical practice.
Practice identifying P waves, QRS complexes, and T waves on real EKG strips.
Sources: Garcia & Holtz, 2013, ECGpedia & LITFL (waveform morphology and characteristics compared and synthesized).
4 EKG Intervals and Segments
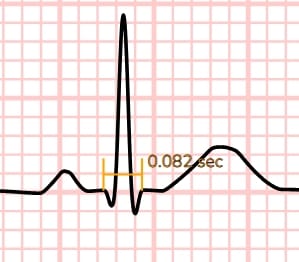
PR Interval
PR interval reflects conduction through the atria, AV node, and His–Purkinje system (onset of P to onset of QRS). Normal 0.12–0.20 s (120–200 ms). Prolonged >0.20 s (>200 ms) = first‑degree AV block. Short <0.12 s (<120 ms) may indicate pre‑excitation (e.g., WPW) or junctional rhythm.
- Normal: 0.12–0.20 s (120–200 ms)
- Short: <0.12 s (<120 ms) – consider pre‑excitation / junctional
- Prolonged: >0.20 s (>200 ms) – first‑degree AV block
Measurement tip: Measure in the lead that shows the clearest onset of P and QRS (commonly lead II; V1 helps with P morphology).
References: Garcia & Holtz, 2013 (12-lead ECG interpretation); AHA ACLS Guidelines (clinical ECG standards).
Example: First-Degree AV Block - Notice the prolonged PR interval (>0.20 seconds)
QRS Duration
The QRS reflects ventricular depolarization time. Widening usually means slowed intraventricular conduction through the His–Purkinje system (bundle branch block, ventricular origin) or an alternate pathway (pre‑excitation, pacing, metabolic / drug effect).
- Normal: ≤0.10 s (≤100 ms; narrow complex)
- Borderline/Incomplete BBB: 0.11–0.12 s (110–120 ms; often reflects incomplete bundle branch block)
- Wide: ≥0.12 s (≥120 ms; suggests delayed intraventricular conduction or ventricular origin)
Measurement tip: Measure from the first ventricular deflection to the point the last deflection returns to baseline (use tangent method if terminal slurred).
Plain language: If the ventricles don't use the fast wiring (His–Purkinje) efficiently, activation spreads cell-to-cell and the QRS widens.
Quick triage reminder: For rapid rhythm assessment, many use <120 ms = narrow, ≥120 ms = wide.
Normal Narrow QRS
Wide QRS Complex (PVC)
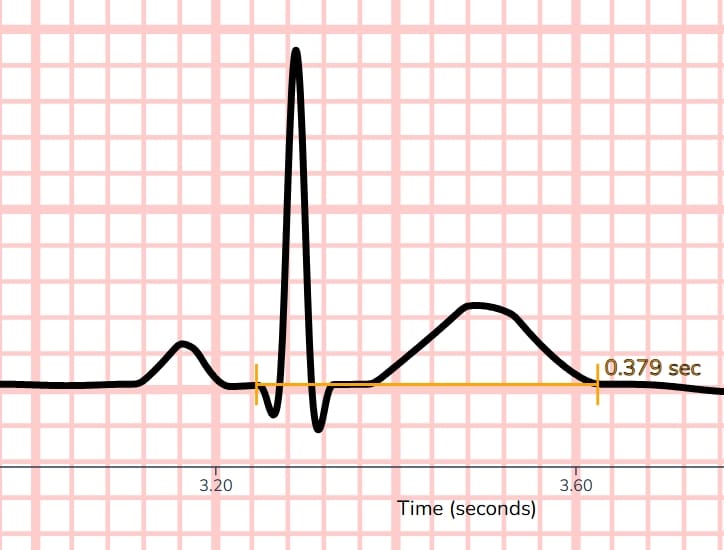
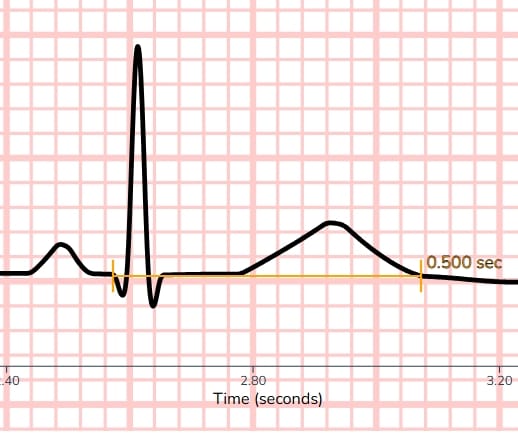
QT Interval
Measures from the beginning of the QRS to the end of the T wave (exclude U wave). Represents total ventricular depolarization + repolarization.
- Quick visual screen: QT < ½ the R–R interval (valid only when HR is 60–100 bpm).
- Use QTc for decisions: Confirm with rate‑corrected QT (monitor auto‑calculation; verify at extreme rates).
- Adult reference (general): Men <450 ms; Women <460 ms.
- Marked prolongation: QTc ≥500 ms (widely used risk threshold for TdP).
- Measure in: Lead II or V5 when morphology is clear.
Heads-up: At very fast or very slow heart rates, automated QTc can be off—double-check visually and correlate clinically.
📏 QT Interval Comparison
✅ Normal QT Interval
Normal QT interval - less than half the R-R interval
⚠️ Prolonged QT Interval
Prolonged QT interval - increases risk of torsades de pointes
🎯 Quick Assessment Tips:
- Visual check: QT < ½ the R–R interval
- Marked: QTc ≥500 ms (heightened torsades risk)
- Consider medications: Antiarrhythmics, antibiotics, antipsychotics
- Monitor for: Torsades de pointes in prolonged QT
🎯 Clinical Pearls
- Always measure intervals in multiple leads for accuracy
- Use lead II or V1 for PR interval measurement
- QRS duration determines narrow vs wide complex rhythms
- QT prolongation can be medication-induced
Sources: Garcia & Holtz, 2013; ECGpedia; LITFL.
5 Heart Rate Calculation: Three Methods
Method 1: 1500 Method (Most Precise for Regular Rhythms)
Use case: Regular rhythms when R waves don't land exactly on heavy lines.
- Formula: 1500 ÷ small boxes (R–R) = HR
- Steps:
- Measure R-R interval in small boxes
- Count small boxes between consecutive R waves
- Divide 1500 by the number of small boxes
- Round to nearest integer
- Accuracy: Most precise for regular rhythms
Interactive demonstration showing R-R interval measurement with small box counting
Method 2: Large Box Method (Quick Reference)
What it is: A memorized shortcut for heart rate calculation using bold grid lines as reference points.
📚 How the Large Box Method Works:
- Find an R-wave on a bold line - This is your starting point
- Count bold lines to the next R-wave - Each bold line = 1 large square
- Use the memorized sequence:
- 1 large square apart = 300 bpm
- 2 large squares apart = 150 bpm
- 3 large squares apart = 100 bpm
- 4 large squares apart = 75 bpm
- 5 large squares apart = 60 bpm
- 6 large squares apart = 50 bpm
⚠️ Paper Speed Alert: These values are for 25 mm/s (most common). At 50 mm/s, double all values: 600-300-200-150-120-100 bpm.
Why these numbers? They represent heart rates based on the distance between R-waves when measured in large squares (0.2 seconds each).
When to use: When R-waves land on or near bold lines. If R-waves fall exactly on bold lines, use the exact sequence value. If R-waves fall between bold lines, approximate the range (e.g., between 3-4 squares = 75-100 bpm).
When NOT to use: For very irregular rhythms or when precision is critical - use the 1500 method instead for accuracy.
Watch how to count large squares between R-waves and apply the memorized sequence values
Method 3: 6-Second Rule (Irregular Rhythms)
Use case: Irregular rhythms (AFib, frequent PVCs, variable block rhythms).
- Method: Count QRS complexes in 6 seconds and multiply by 10
- Steps:
- Find 6-second strip (30 large squares at 25 mm/s)
- Count all QRS complexes in that window
- Multiply by 10 for beats per minute
- For 10-second strips: count and multiply by 6 (standard 12-lead EKGs are typically 10-second recordings)
EKG strip with 6-second markers and numbered QRS complexes for counting
Method Selection Guidelines
🎯 CHOOSING THE RIGHT METHOD
- Check regularity: Irregular if the difference between the longest and shortest R-R interval on the strip is ≥3 small boxes (≥0.12 s). Otherwise regular.
- If irregular: Use 6-second rule
- If regular:
- R-waves near bold lines → Large box method (exact values or approximate ranges)
- Otherwise → 1500 method
Practice calculating heart rates using different methods on various rhythm strips.
🎯 When to Use Each Method
- 1500 method: Most precise for regular rhythms
- Large box method: When R-waves are near bold lines (use exact values or approximate ranges)
- 6-second rule: All irregular rhythms (AFib, variable block, frequent PVCs)
- Clinical priority: Method selection should be data-driven, not rhythm-label-driven
Sources: Garcia & Holtz, 2013, ECGpedia & LITFL (heart rate calculation methods compared and synthesized).
6 Systematic EKG Interpretation Method
The 5-Step Approach
Follow this systematic approach for every EKG to avoid missing important findings:
📋 STEP-BY-STEP METHOD
- RATE: Calculate heart rate (normal: 60-100 bpm)
- RHYTHM: Regular or irregular? Are QRS complexes evenly spaced?
- P WAVES: Present? P before every QRS and QRS after every P? Upright in lead II?
- PR INTERVAL: Normal duration (0.12-0.20 sec)? Consistent?
- QRS: QRS width: Normal ≤0.10 s (≤100 ms); Borderline 0.11–0.12 s (110–120 ms); Wide ≥0.12 s (≥120 ms). Morphology?
Additional Considerations
- ST Segments: Elevated? Depressed? (ischemia, injury)
- T Waves: Inverted? Peaked? (electrolyte imbalances, ischemia)
- U Waves: Present? (hypokalemia, medications)
- Axis Deviation: Normal, left, right, or extreme axis?
Practice the 5-step method on various EKG strips with guided feedback.
Systematic Interpretation Practice
🎯 Pro Tips for Success
- Always use the same systematic approach - don't skip steps
- Look at multiple leads to confirm findings
- Consider the clinical context - symptoms, medications, history
- When in doubt, compare to previous EKGs if available
- Don't rely on machine interpretation alone
Sources: Garcia & Holtz, 2013; LITFL; ECGpedia.
7 Essential Cardiac Rhythms
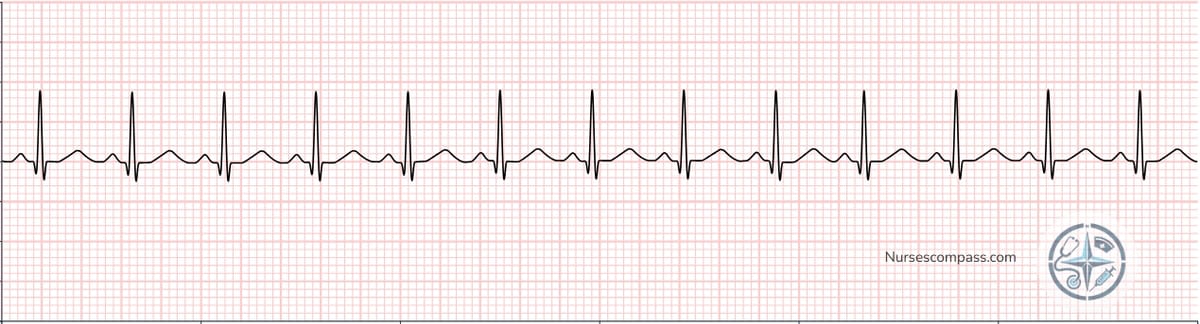
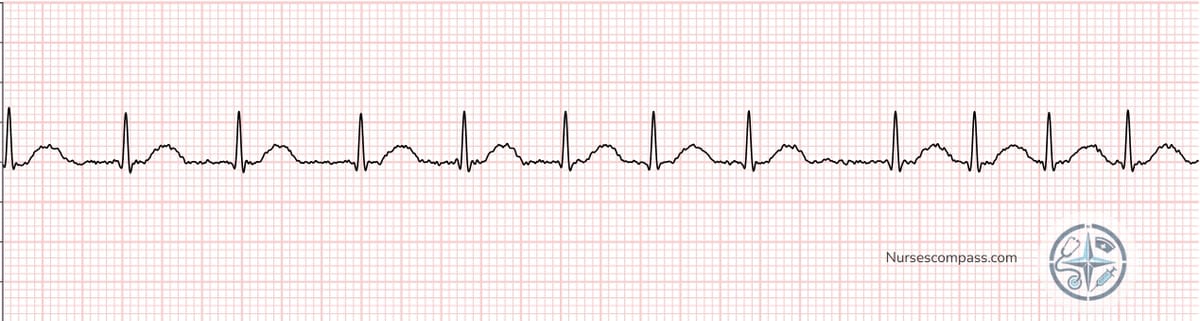
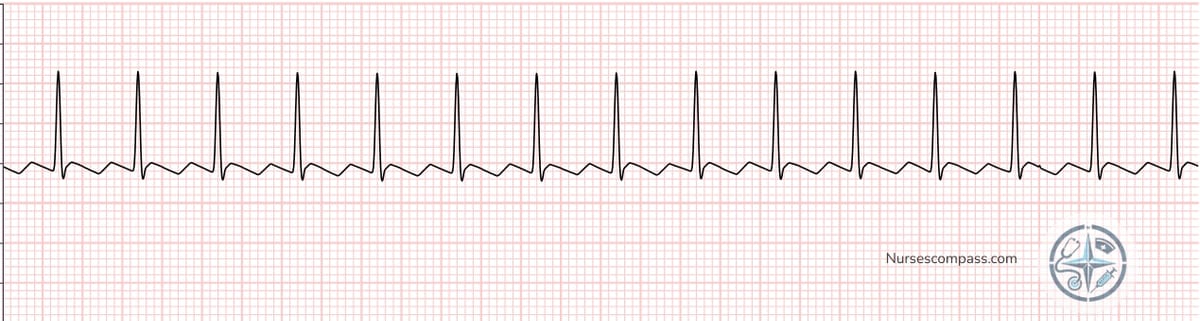
Normal and Sinus Rhythms
Tip: Click / tap any rhythm strip image below to enlarge it for closer inspection. (No simulator redirect.)
• Regular rhythm
• P waves present before each QRS
• Normal PR interval
• Regular rhythm
• P waves present before each QRS
• Normal PR interval
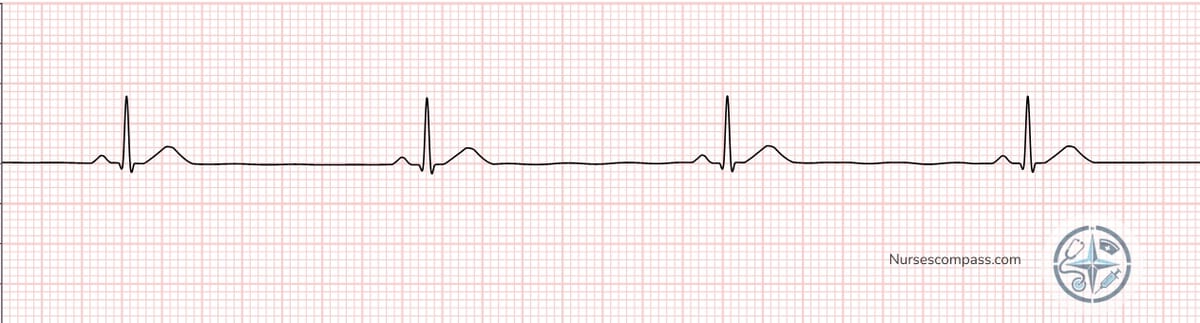
• Regular rhythm
• P waves present before each QRS
• Normal PR interval
Atrial Arrhythmias
• No identifiable P waves
• Fibrillatory baseline
• Variable ventricular response
• Regular or irregular ventricular response
• Flutter rate: 250-350 bpm
• Common ratios: 2:1, 3:1, 4:1
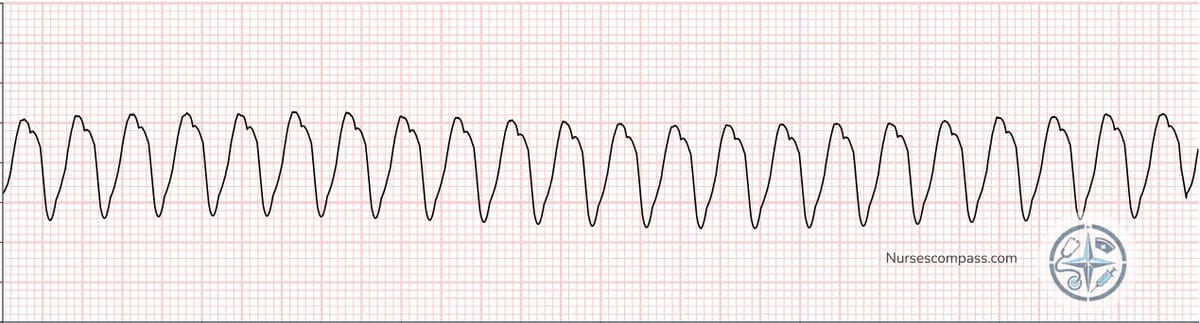
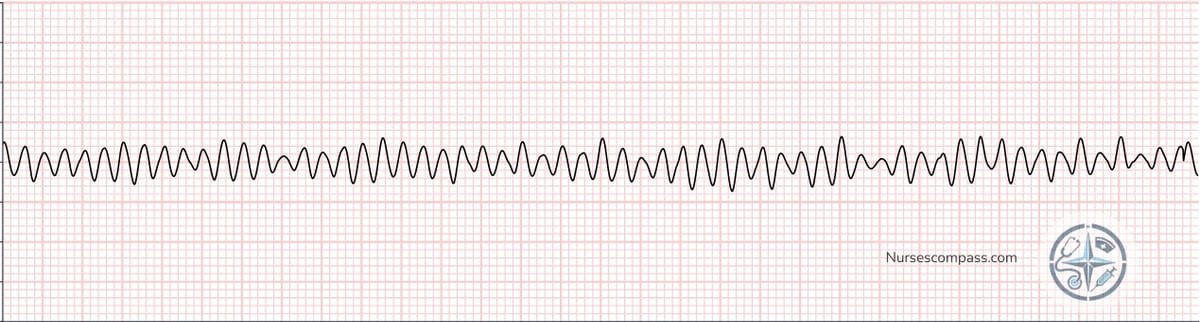
Ventricular Arrhythmias
• Wide QRS complexes (≥0.12 sec)
• Regular or slightly irregular
• Potentially life-threatening wide-complex tachycardia pattern. Learning focus: recognize morphology & assess perfusion/stability. Escalation/management follow local policy under licensed providers.
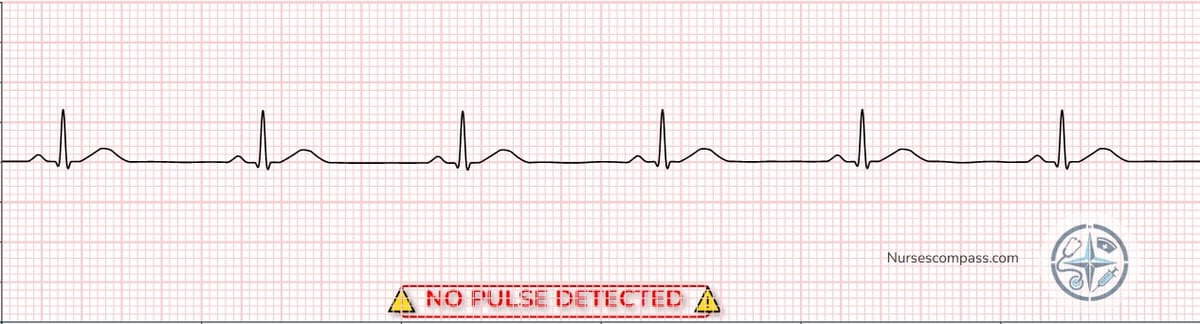
• No identifiable QRS complexes
• No cardiac output
• Pattern associated with cardiac-arrest pathways. Learning focus: rapid recognition & activation of emergency response systems. Management follows current institutional policy and licensed provider direction.
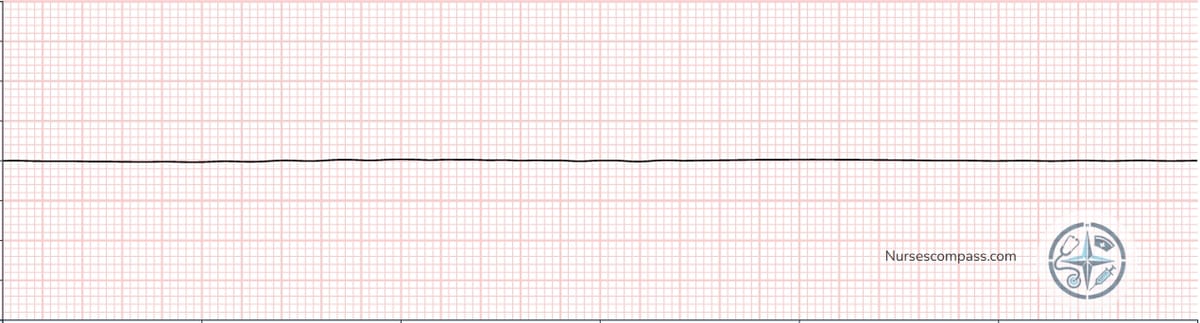
• Flat line on monitor
• No cardiac output
• Non-shockable arrest pattern in standard pathways. Educational focus: recognition and prompt escalation under current institutional guidance.
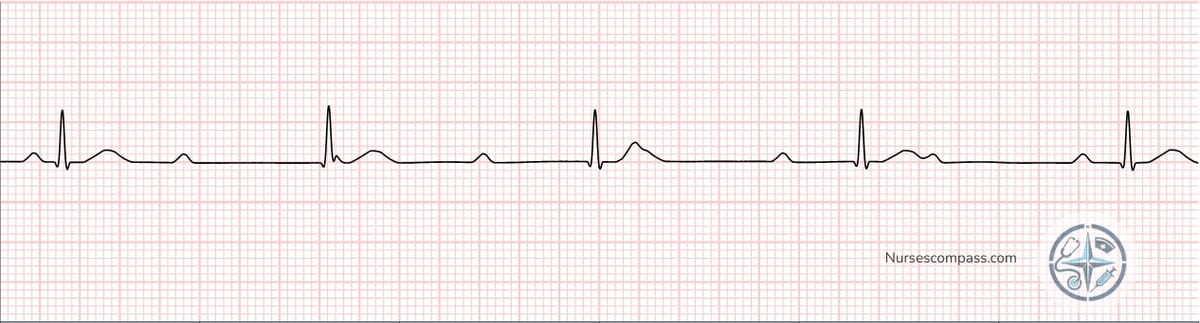
Heart Blocks
• Regular rhythm
• P waves present before each QRS
• Usually benign
• No relationship between P and QRS
• Escape rhythm present
• Atrioventricular dissociation with escape rhythm. Educational focus: recognize and escalate to the licensed care team per policy.
Sources: Garcia & Holtz, 2013 (rhythm descriptions and characteristics); AHA 2020/2023 (escalation protocols).
8 Clinical Applications & Emergency Recognition
Life-Threatening Rhythms
These rhythms require immediate recognition and intervention:
🚨 HIGH-RISK RHYTHMS (Recognition Focus – Verify With Current ACLS)
💡 Click on any rhythm strip image to enlarge and study the details
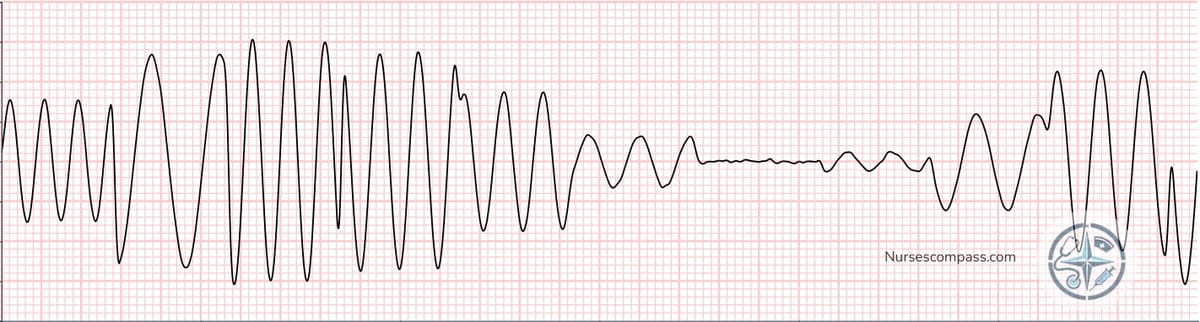
Ventricular Fibrillation
Recognition pattern: Chaotic ventricular activity with no organized QRS; rapid identification and escalation required.
Ventricular Tachycardia
Recognition pattern: Sustained wide-complex tachycardia (≥0.12 s), usually regular; assess perfusion/stability and escalate.
Torsades de Pointes
Recognition pattern: Polymorphic VT with twisting axis, often after prolonged QT; consider reversible contributors.
Asystole
Recognition pattern: No discernible electrical activity; non-shockable in standard arrest pathways.
PEA (Pulseless Electrical Activity)
Recognition pattern: Organized electrical activity without a pulse; think Hs & Ts while escalating.
Third-degree (Complete) AV Block
Recognition pattern: AV dissociation with escape rhythm; monitor perfusion and escalate.
Common Clinical Scenarios
Nursing Interventions by Rhythm
🩺 NURSING ACTIONS (Recognition & Escalation Focus)
- Bradycardia: Assess perfusion, vitals, symptoms; review recent meds; escalate per policy.
- Tachycardia: Assess stability (LOC, BP, symptoms); obtain vitals; communicate findings; follow provider/institutional direction.
- Irregular rhythms: Monitor hemodynamics; document strip characteristics; notify provider per policy.
- New arrhythmias: Prompt assessment, documentation, provider notification; compare to prior tracings when available.
A 65-year-old patient presents with chest pain. Their EKG shows a rate of 45 bpm, regular rhythm, and a PR interval of 0.28 seconds. What is your interpretation?
Sources: Garcia & Holtz, 2013; AHA 2020 ACLS.
❓ EKG Interpretation FAQ
Quick answers to the most common EKG questions nursing students and new clinicians ask. Master the core numbers, timing, and rhythm rules that appear again and again on exams and in patient care.
What are the normal EKG intervals I should memorize?
Best quick method to calculate heart rate on a regular rhythm?
EKG vs ECG – is there a difference?
When is a PVC concerning?
How do I distinguish atrial fibrillation from atrial flutter?
What’s the first priority when you see a wide-complex tachycardia?
How can I get faster at interpretation?
📚 References & Sources ▼
Authoritative sources supporting interpretation content
- American Heart Association. (2020). Adult Advanced Life Support: 2020 American Heart Association Guidelines for CPR and ECC. Circulation. https://doi.org/10.1161/CIR.0000000000000916
- Panchal, A. R., Bartos, J. A., Cabañas, J. G., et al. (2024). 2023 American Heart Association Focused Update on Adult Advanced Cardiovascular Life Support. Circulation, 149(5), e254–e273. PubMed: https://pubmed.ncbi.nlm.nih.gov/38108133/
- Garcia, T. B., & Holtz, N. E. (2013). 12-Lead ECG: The Art of Interpretation (2nd ed.). Jones & Bartlett Learning.
- Life in the Fast Lane (LITFL). ECG rate interpretation (1500, sequence, 6-second methods). https://litfl.com/ecg-interpretation-ecg-rate-interpretation/
- ECGpedia. Conduction & intervals (PR, QRS, QT/QTc normal values). https://en.ecgpedia.org/wiki/Conduction
Note: Where numerical ranges (e.g., PR 0.12–0.20 s; QRS 0.06–0.10 s; QTc thresholds) are presented, they reflect consensus from guideline and review sources above.
Always verify treatment actions against your institution’s policies and the most current ACLS publications.
Last updated .
Disclosure: Some links below are affiliate links. As an Amazon Associate we earn from qualifying purchases at no additional cost to you. These help support creation of free educational content.
📚 Recommended EKG Study Resources
💡 Pro Tip for EKG Mastery
This guide covers the fundamentals, but mastering EKG interpretation requires extensive practice with real strips and comprehensive reference materials. Consider adding a dedicated EKG interpretation book to your study arsenal for advanced arrhythmias and clinical correlations.
EKG Interpretation Made Easy
Illustrated GuideStudent-friendly illustrated study guide specifically designed to make ECG strip interpretation easy to learn and understand.
View on Amazon (affiliate link)12-Lead ECG: The Art of Interpretation
Garcia 2nd EditionComprehensive 12-lead ECG interpretation guide with 3-level approach. Features real-life ECG strips, friendly tone, and 50 practice ECGs with detailed discussions.
View on Amazon (affiliate link)💡 Study Strategy: Use the EKG guide alongside this free interactive tutorial. Practice with real strips, then reference the book for detailed explanations and additional rhythms.
Continue Learning
EKG Simulator
Practice with 30+ interactive EKG rhythms
NCLEX Study Guide
Complete NCLEX test plan, structure, and preparation strategies
How to Read an EKG Strip
Step-by-step beginner guide to EKG strip analysis
15 Must-Know EKG Rhythms
Essential cardiac rhythms every nurse needs to recognize
⚠️ Important Medical and Educational Disclaimer
FOR EDUCATIONAL PURPOSES ONLY: This EKG interpretation guide is designed exclusively for nursing education and should never replace clinical judgment, physician interpretation, institutional protocols, or current evidence-based practice guidelines. All cardiac rhythm interpretations and patient care decisions must be made by qualified healthcare providers based on individual patient assessment and clinical context.
NO MEDICAL ADVICE: This content does not constitute medical advice, diagnosis, or treatment recommendations. Always consult with healthcare providers and follow institutional policies for patient-specific care decisions. EKG interpretation requires extensive training and clinical experience.
💙 Support Our Free Content
Your support helps us continue creating free nursing content. Explore our Nursing Essentials page to see our recommended tools and resources.
🛍️ View Nursing Essentials