How to Read an EKG/ECG Strip: Step-by-Step Guide for Nursing Students
A beginner-friendly, systematic approach to electrocardiogram (EKG/ECG) strip interpretation — from understanding the paper to identifying abnormalities
Learning to read an EKG strip can feel overwhelming at first — between the squiggly lines, tiny boxes, and unfamiliar waveforms, it's easy to get lost. But here's the good news: EKG interpretation follows a predictable, step-by-step process. Once you learn it, you'll use the same systematic approach every single time.
This guide breaks down EKG strip reading into 6 clear steps that you can memorize, practice, and apply in clinicals, on exams, and on the NCLEX. Whether you're seeing your first rhythm strip or reviewing for a cardiac exam, this is the method that will stick.
🩺 Practice along in our free EKG Simulator | 📄 Printable reference: 18 rhythms, PQRST diagram & memory aids
$4.99 — Get the Cheat SheetUnderstanding EKG Paper: The Grid That Makes It All Work
Before you can interpret a rhythm, you need to understand what the paper is telling you. EKG paper is standardized graph paper that records both time (horizontal axis) and voltage (vertical axis).
EKG Paper Quick Reference
| Measurement | Small Box | Large Box (5 small) |
|---|---|---|
| Width (Time) | 1 mm = 0.04 seconds | 5 mm = 0.20 seconds |
| Height (Voltage) | 1 mm = 0.1 mV | 5 mm = 0.5 mV |
The paper runs through the EKG machine at a standard speed of 25 mm/second. This means 30 large boxes equal exactly 6 seconds of recorded time — a fact that becomes critical for heart rate calculation.
Study Tip
Memorize these two numbers: 300 and 1500. You'll use 300 ÷ (number of large boxes between R waves) for regular rhythms, and 1500 ÷ (number of small boxes between R waves) for a more precise calculation. These shortcuts come from the standardized paper speed.
The PQRST Complex: Know Your Waveforms
Every normal heartbeat produces a characteristic pattern of waveforms on the EKG strip. These waves are labeled P, Q, R, S, and T — and each one represents a specific electrical event in the heart.
Think of it like a relay race: The P wave is the atria contracting (first runner), the flat line between the P and QRS is the brief pause at the AV node (handoff), the QRS is the ventricles firing (second runner), and the T wave is the ventricles resetting for the next beat (recovery).
PR Interval vs. PR Segment
PR Interval = start of the P wave to the start of the QRS complex (this is what you measure clinically; normal 0.12–0.20 sec). PR Segment = just the flat line between the end of the P wave and the start of the QRS. The interval includes the P wave + the segment. On exams, "PR interval" is almost always what they're asking about.
The 6-Step Method for Reading Any EKG Strip
Use this same systematic approach every time you look at a rhythm strip. Consistency prevents mistakes — don't skip steps, even if the rhythm looks obvious.
Calculate the Heart Rate
The heart rate tells you immediately whether you're looking at a normal, fast, or slow rhythm. There are two reliable methods:
Method A — The 6-Second Method (best for irregular rhythms):
- Count 30 large boxes on the strip (this equals 6 seconds)
- Count the number of R waves (tall upward spikes) within those 30 boxes
- Multiply by 10 to get beats per minute (bpm)
Method B — The Sequence Method (best for regular rhythms):
- Find two consecutive R waves
- Count the number of large boxes between them
- Divide 300 by that number
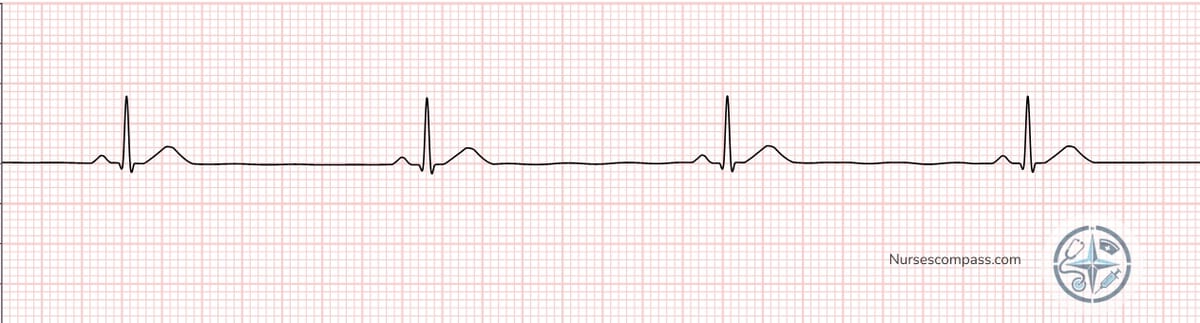
Sinus Bradycardia — notice the wider spacing between R waves, indicating a slower heart rate
Quick Memorization Trick
For the sequence method, memorize: 300 – 150 – 100 – 75 – 60 – 50. Each number corresponds to 1, 2, 3, 4, 5, or 6 large boxes between R waves. If R waves are 4 large boxes apart, the rate is 75 bpm.
Determine the Rhythm: Regular or Irregular?
Next, determine whether the R-R intervals (the distance between consecutive R waves) are consistent or variable.
- Regular rhythm: R-R intervals are equal throughout the strip (consistent spacing)
- Regularly irregular: There is a repeating pattern of irregularity (e.g., grouped beating in Wenckebach)
- Irregularly irregular: No pattern at all — the hallmark of atrial fibrillation
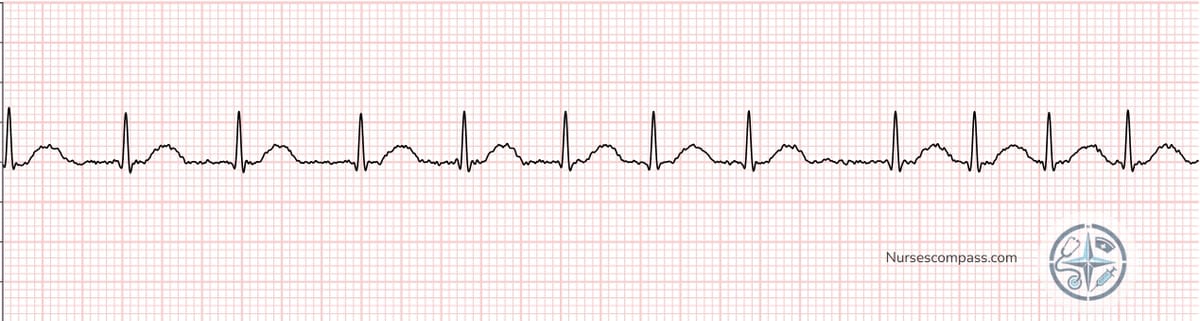
Atrial Fibrillation — notice the completely irregular R-R intervals and absent P waves
Practical Tip
The "march-out" method: Place a piece of paper along the strip and mark where each R wave falls. Then slide the paper across — if all marks line up with subsequent R waves, the rhythm is regular. This is a technique commonly taught in nursing programs and used at the bedside.
Identify the P Waves
P waves represent atrial depolarization — the electrical signal that causes the atria to contract. When analyzing P waves, ask yourself:
- Are P waves present? (Absent in atrial fibrillation and junctional rhythms)
- Do they all look the same? (Consistent shape = one pacemaker site; varying shapes = multiple foci)
- Is there one P wave before every QRS? (1:1 ratio = normal conduction)
- Are they upright in Lead II? (Upright = sinus origin; inverted = junctional or retrograde conduction)
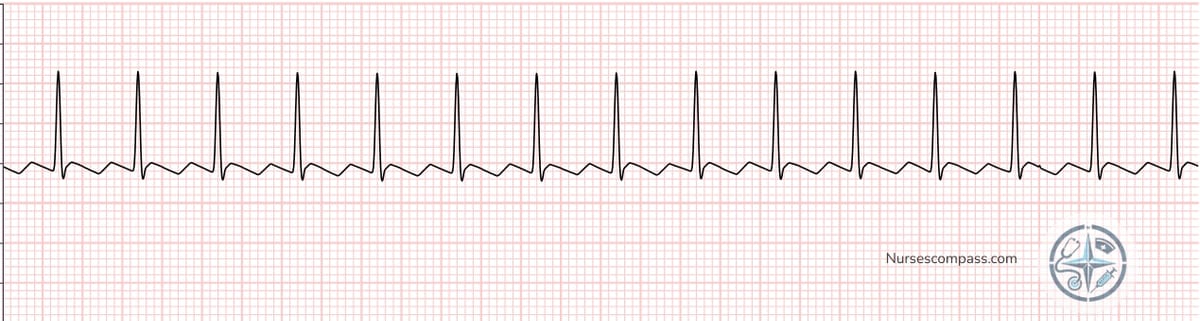
Atrial Flutter — instead of distinct P waves, you see a "sawtooth" pattern of flutter waves (F waves)
Common Mistakes
- Confusing T waves with P waves — P waves are smaller and come before the QRS
- Missing hidden P waves buried in the T wave (look for a T wave that looks taller or differently shaped than the others)
- Assuming "no P wave = atrial fib" — junctional rhythms also lack visible P waves
Measure the PR Interval
The PR interval measures the time it takes for the electrical impulse to travel from the atria, through the AV node, to the ventricles. Measure from the beginning of the P wave to the beginning of the QRS complex.
What abnormal PR intervals tell you:
- Prolonged (> 0.20 sec): First-degree AV block — the impulse is delayed (but still gets through)
- Progressively lengthening PR: Second-degree AV block Type I (Wenckebach) — the delay increases until a beat is dropped
- Short (< 0.12 sec): May indicate an accessory pathway (e.g., Wolff-Parkinson-White syndrome) or junctional origin
- Variable/absent: Third-degree (complete) heart block — atria and ventricles are firing independently
First-Degree AV Block — the PR interval is consistently prolonged beyond 0.20 seconds, but every P wave is followed by a QRS
Measure the QRS Complex
The QRS complex represents ventricular depolarization — the ventricles contracting to pump blood. Measure from where the Q wave starts (or R wave if no Q) to where the S wave ends.
Why QRS width matters:
- Narrow QRS (< 0.12 sec): The impulse is traveling normally through the bundle branches — this means the rhythm is likely supraventricular in origin (originating above the ventricles)
- Wide QRS (≥ 0.12 sec): The impulse is taking an abnormal path — this can mean a ventricular origin (like VT or PVCs), a bundle branch block, or conduction with aberrancy
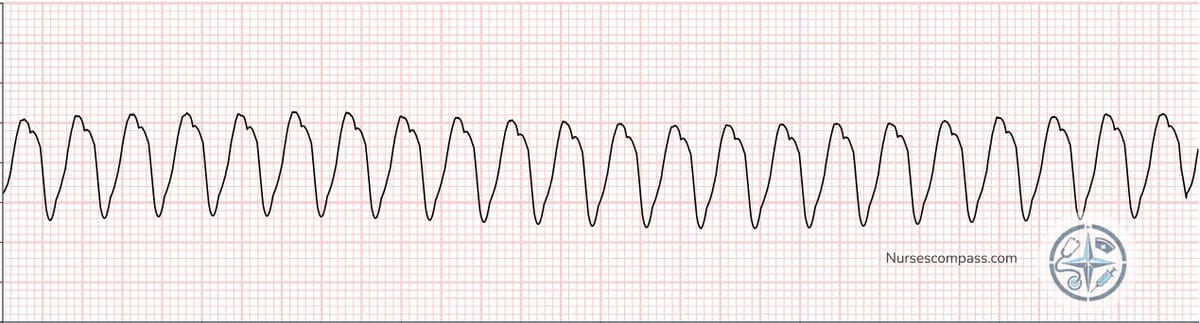
Ventricular Tachycardia — notice the wide, bizarre QRS complexes indicating ventricular origin
Critical Distinction
Wide QRS + fast rate = possible ventricular tachycardia — this is a life-threatening arrhythmia. If a patient has a wide-complex tachycardia and you're unsure whether it's VT or SVT with aberrancy, per ACLS guidelines, treat it as VT until proven otherwise. Always correlate with the patient's hemodynamic status.
Evaluate the ST Segment
The ST segment is the flat section between the end of the S wave and the beginning of the T wave. Normally, it sits at the baseline (isoelectric line). Changes in the ST segment can indicate serious cardiac events.
What to look for:
- ST elevation: The ST segment is raised above the baseline — this is the hallmark finding of an acute myocardial infarction (STEMI) and requires emergent intervention
- ST depression: The ST segment dips below the baseline — may indicate myocardial ischemia, digoxin effect, or ventricular hypertrophy
- Normal/flat: The ST segment sits along the baseline — no acute ischemic changes
When ST Changes Are an Emergency
New ST elevation in two or more contiguous leads (leads that look at the same area of the heart) is a STEMI until proven otherwise. This is a time-critical diagnosis. Per the American Heart Association, the goal is door-to-balloon time of less than 90 minutes. If you see new ST elevation, notify the provider immediately.
NCLEX Tip
The NCLEX often tests your ability to recognize ST elevation as a priority finding. In a question with multiple assessment findings, new ST elevation typically takes priority because it indicates acute tissue damage that worsens with time.
Putting It All Together: Practice Reading
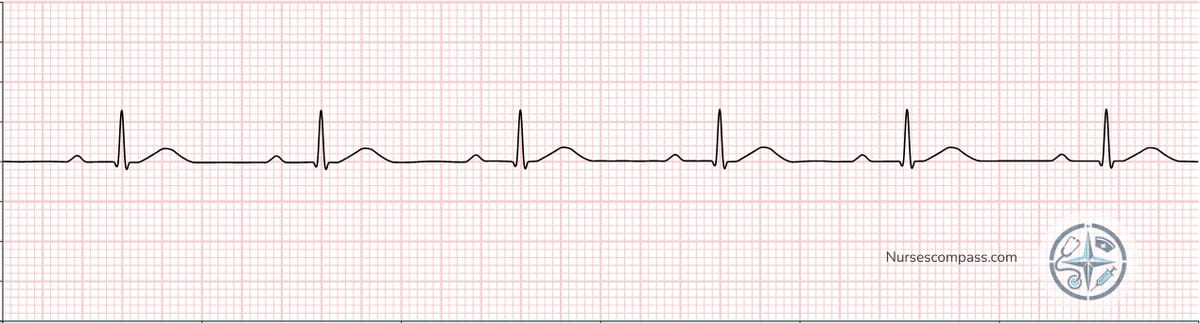
Let's walk through a complete example using all 6 steps. Look at this strip:

6-Step Analysis
- Heart Rate: R-R intervals span approximately 3–5 large boxes = 60–100 bpm (normal)
- Rhythm: R-R intervals are consistent = regular
- P Waves: Present before every QRS, upright, uniform in shape = sinus origin
- PR Interval: Consistent at approximately 0.16 seconds = normal conduction
- QRS Complex: Narrow, less than 0.12 seconds = normal ventricular depolarization
- ST Segment: Flat at the baseline = no acute ischemic changes
Interpretation: Normal Sinus Rhythm (NSR) — all 6 criteria are within normal limits.
Red-Flag Rhythms: What Demands Immediate Action
While every abnormal rhythm deserves attention, some require immediate intervention. As a nursing student, you should be able to recognize these instantly:
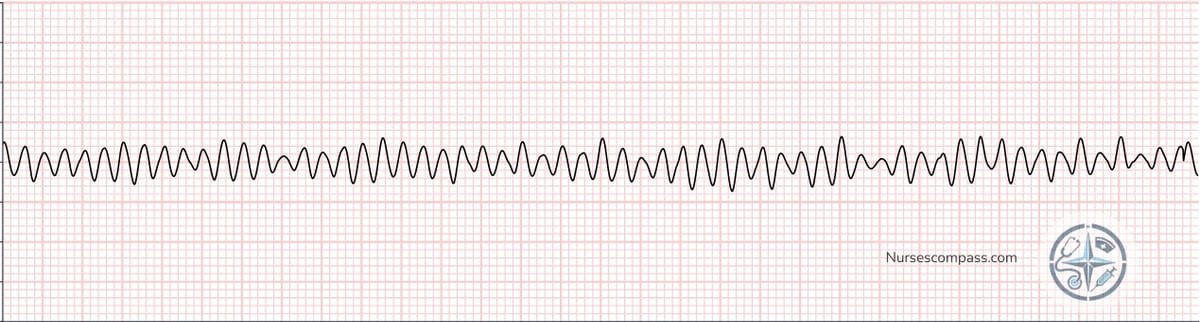
Ventricular Fibrillation — chaotic, disorganized electrical activity with no identifiable waveforms
Want to see all of these rhythms in action and practice identifying them? Our EKG simulator lets you toggle between rhythms and observe their characteristics in real time.
🩺 Practice along in our free EKG Simulator | 📄 Printable reference: 18 rhythms, PQRST diagram & memory aids
$4.99 — Get the Cheat SheetYour 6-Step Cheat Sheet
Rate → Rhythm → P Waves → PR Interval → QRS Complex → ST Segment
Use this same sequence every time. Consistency builds speed. Speed builds confidence. And confidence saves lives in the clinical setting.
Continue Your Learning
Frequently Asked Questions
Medical Disclaimer
This content is for educational purposes only and is NOT intended for clinical use, patient care, or emergency situations. Always consult current medical protocols, facility guidelines, and healthcare providers for patient care decisions. Do not use this information for patient diagnosis or treatment.
References & Sources ▼
Click to view 4 sources cited